
AUD/CAD Nears Parity: Why the 1.0000 Level Matters
AUD/CAD is once again approaching one of the most psychologically important levels in the currency market: parity. Parity simply means that 1 Australian Dollar is worth 1 Canadian Dollar.
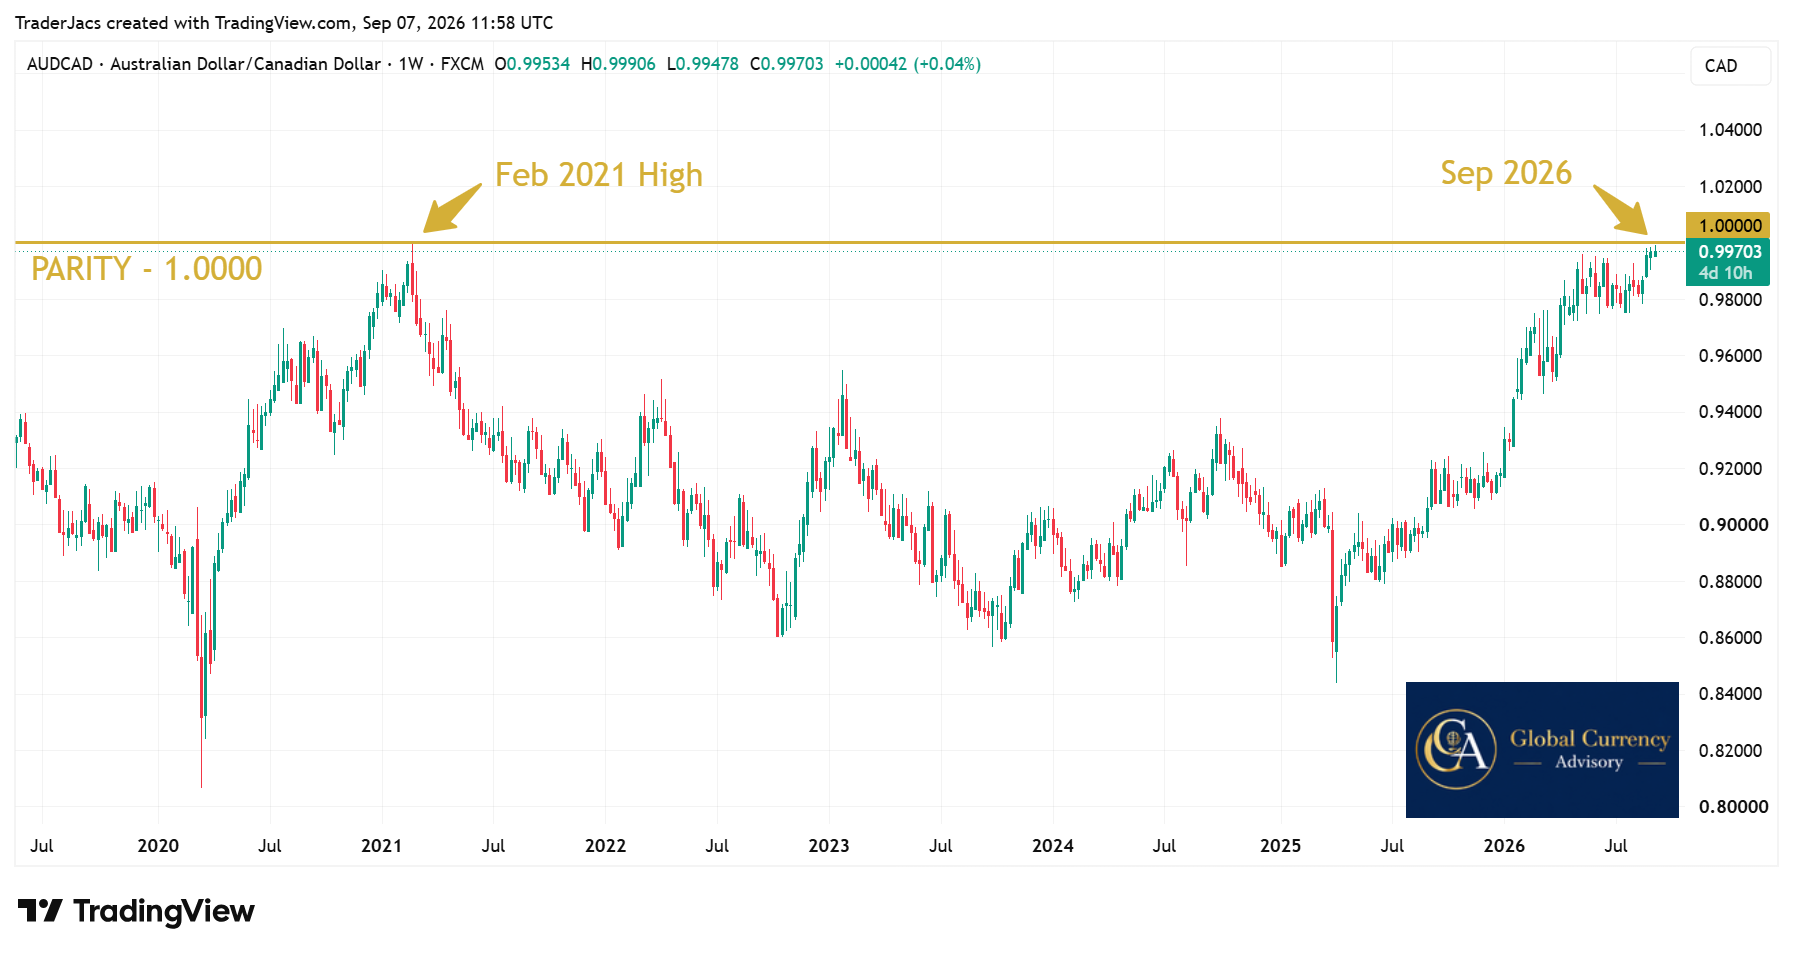
While the exact exchange rate changes constantly, AUD/CAD has recently climbed back into the 0.99 region, placing it very close to 1.0000 - an area it has not revisited since February 2021. As the chart shows, the pair reached a high of 0.9993 during February 2021, while recent September 2026 trading has again pushed the pair to within touching distance of parity. For anyone transferring substantial amounts between Australia and Canada, this is an interesting market level to be aware of. Not because it tells us what will happen next, but because even relatively small movements in exchange rates can have a meaningful impact on the amount of money received.
Why parity matters
Parity is one of those levels that attracts attention because it's so easy to understand.
At:
1.0000
every Australian dollar converts into one Canadian dollar before fees and provider margins.
At:
0.9900
every Australian dollar converts into 99 Canadian cents.
That might sound insignificant.
On everyday purchases it probably is.
On an overseas property purchase, inheritance transfer or business payment, it certainly isn't.
The important point isn't that parity is somehow magical - it's that the closer exchange rates move toward 1.0000, the easier it becomes to visualise the difference between the two currencies.
A quick historical perspective
The chart above highlights two periods separated by more than five years.
In February 2021, AUD/CAD rallied to around 0.9993, coming extremely close to parity before moving away again.
Fast forward to September 2026, and for the past two weeks the pair has once again almost returned to the same area, with trading last week reaching around 0.9983.
That's what makes this chart interesting.
It's showing the market revisiting a level that hasn't been tested for years.
It is context, not a prediction.
What does this mean in real money?
Imagine you're converting A$500,000 into Canadian dollars.
Here's how a relatively small difference in the exchange rate changes the amount received.
Illustrative example
Exchange rate | Canadian dollars received |
0.9900 | C$495,000 |
0.9950 | C$497,500 |
1.0000 | C$500,000 |
A movement of just 1 cent between 0.9900 and parity changes the outcome by C$5,000 on a A$500,000 transfer.
Of course, your actual result will also depend on the exchange rate offered by your provider, any margin applied to the rate, and transfer fees.
That's why it's often worth comparing providers as well as keeping an eye on the underlying market.
Is parity guaranteed to be reached?
No.
And this is where it's important to separate market observation from market prediction.
A chart can tell us where price has traded historically.
It cannot tell us with certainty where it will trade tomorrow, next week or next month.
AUD/CAD may break through parity, reject the level again, or simply continue moving either side of it. Nobody knows with certainty.
For that reason, I prefer to use charts like this as an educational tool rather than a forecasting tool.
If you're planning a large transfer between Australia and Canada in the coming weeks or months, understanding where the market currently sits can help you have more informed conversations with your FX provider about timing and available options.
Why this matters if you're moving money
If you're:
buying or selling property between Australia and Canada
relocating overseas
transferring an inheritance
moving business funds internationally
repatriating savings or investments
then exchange-rate movements of even 0.5% or 1% can represent thousands of dollars.
The goal isn't to try and predict every market move.
It's to understand the market you're operating in, compare the rates being offered, and make informed decisions about how and when you transfer your money.
Market Insight Disclaimer
This article is provided for general educational purposes only and should not be considered financial, investment or trading advice. Currency markets are constantly changing, and historical price movements do not guarantee future outcomes. Always consider your own circumstances and seek appropriate professional advice where necessary.
Chart source: TradingView.


